
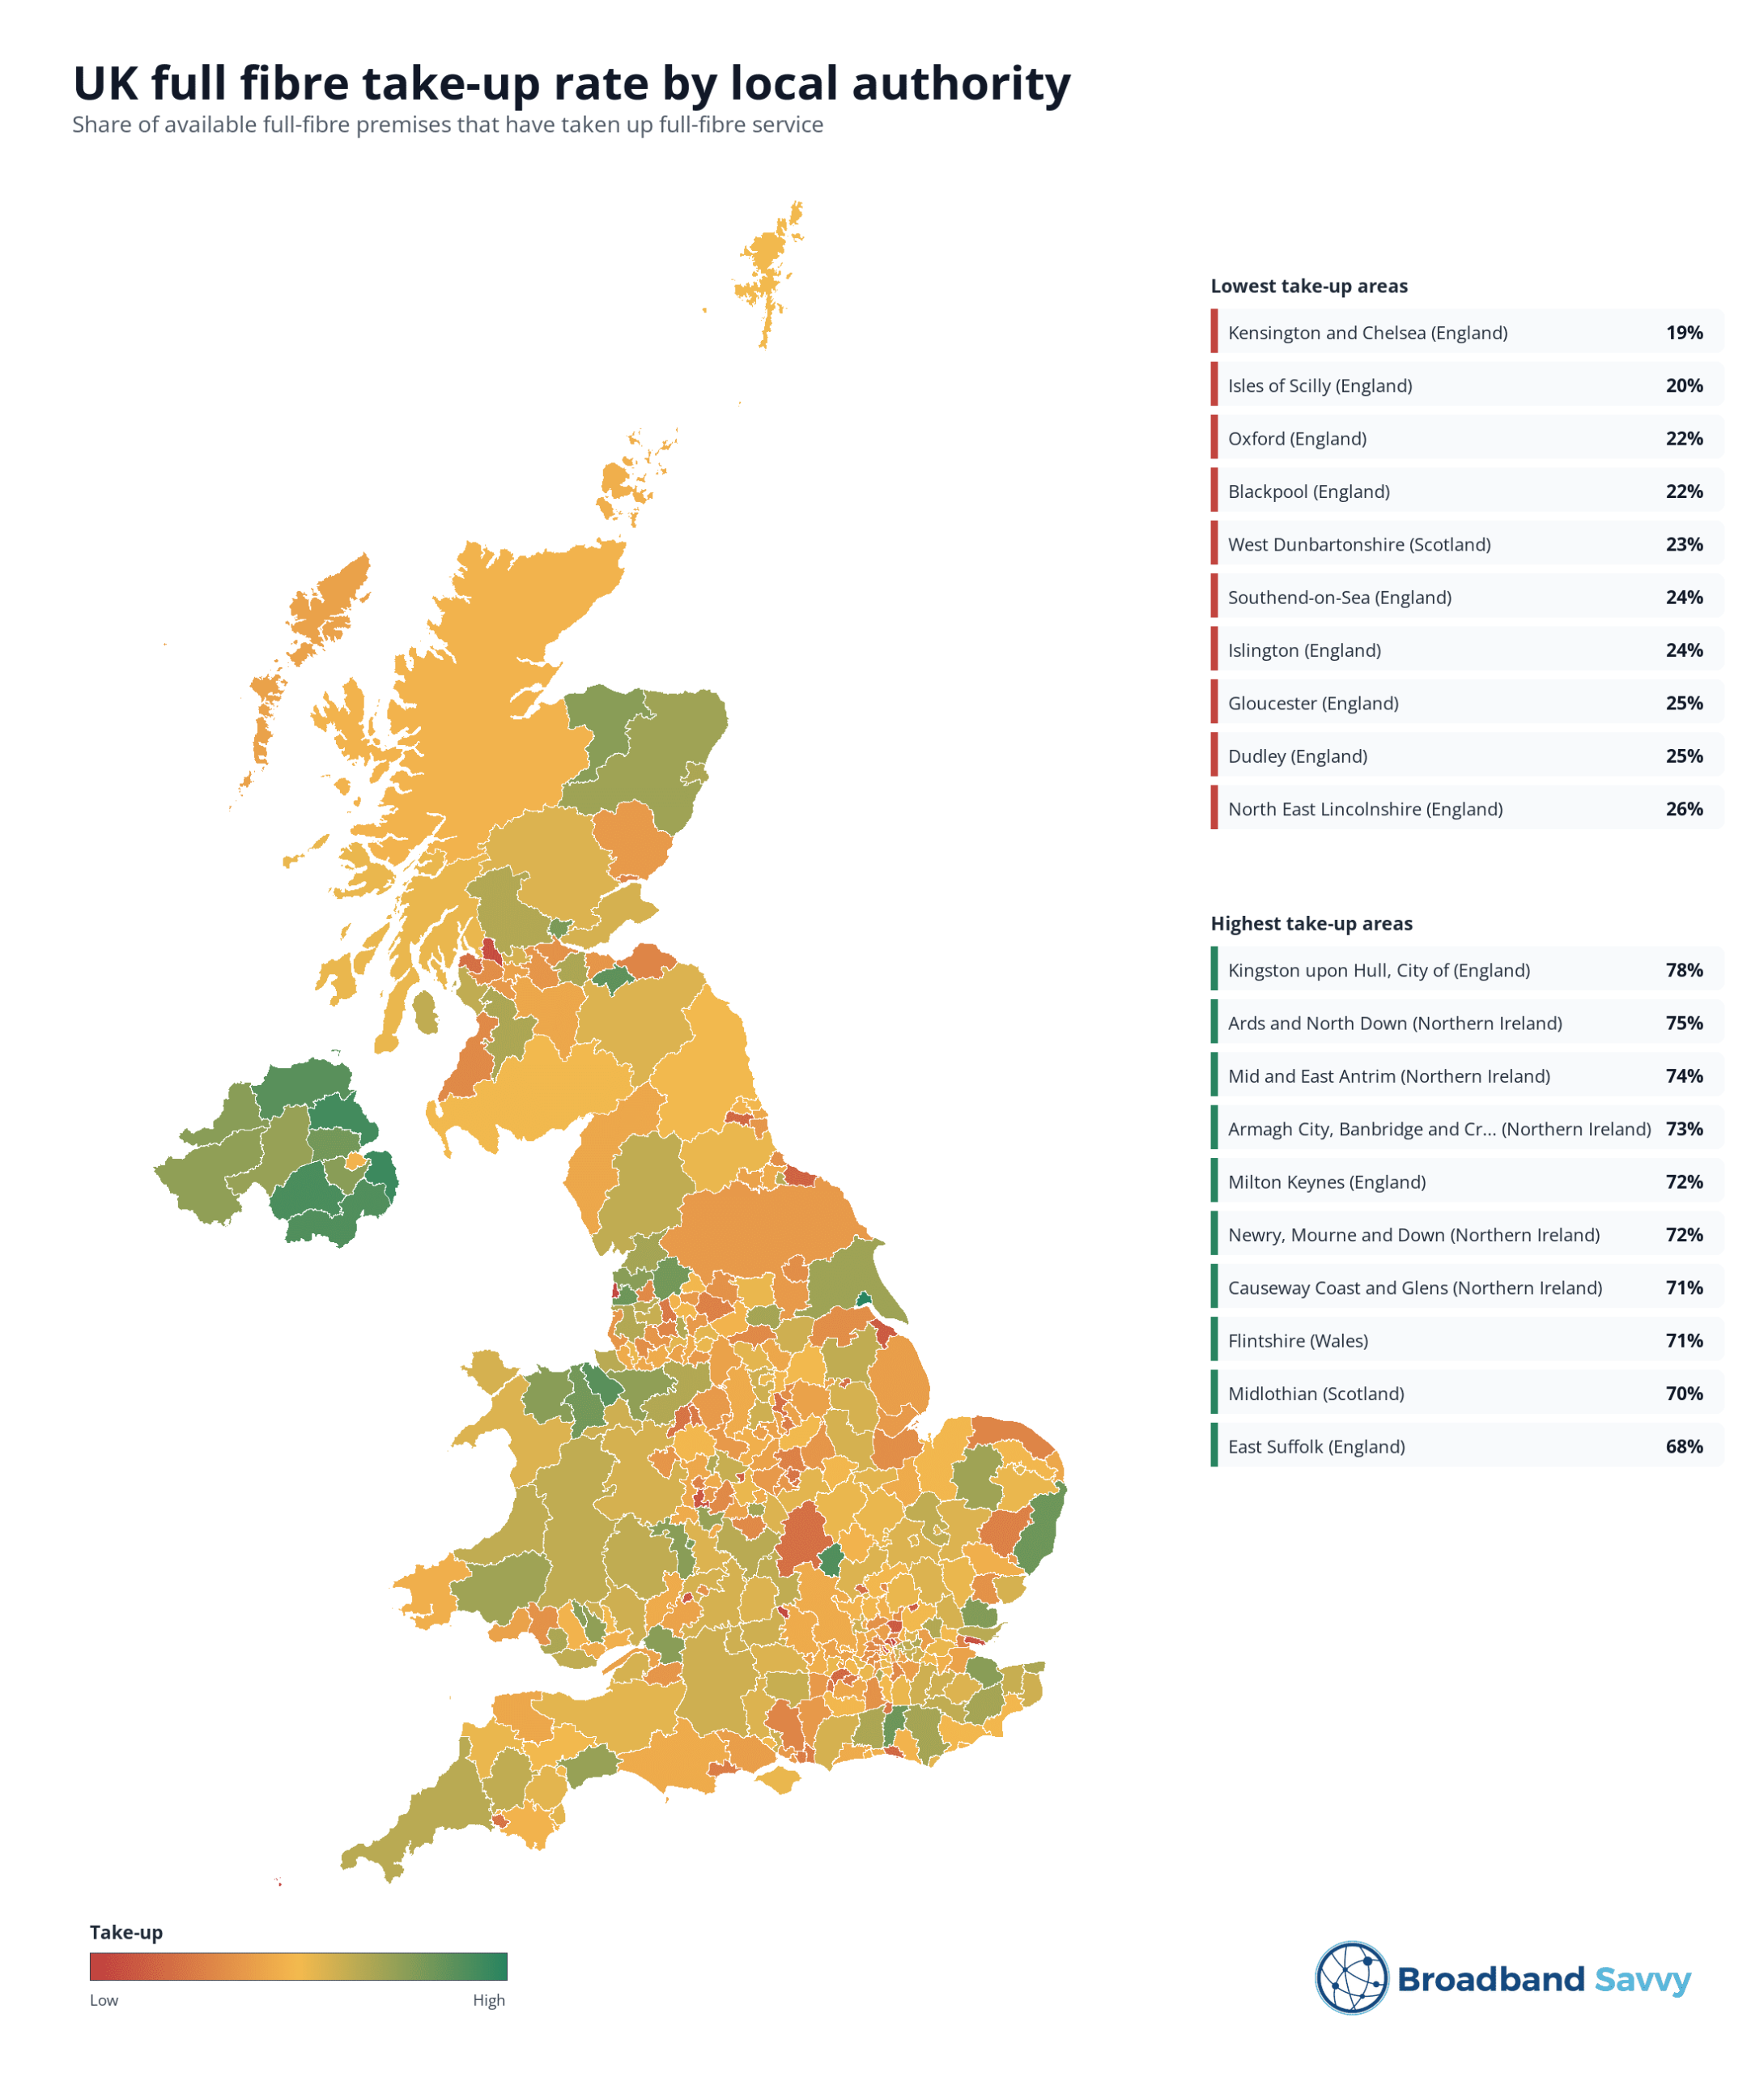
Full fibre broadband is rapidly being rolled out around the UK, and currently 85% of the country is able to access the technology.
However, in certain regions, only 20 to 25 percent of households have so far chosen to make the upgrade to full fibre – compared to more than 75 percent in other areas – leading to a significant digital divide across the UK.
Contents
The study
Nationally, full fibre broadband is available at 85% of addresses, and of these premises, 47% have made the switch.
But many areas of the country have full fibre take-up rates less than half of the national average.
We analysed Ofcom and ONS data to find out which parts of the UK are missing out on full fibre, and the reasons why these areas are choosing not to use the technology.
Findings
- Local Authority Areas in the bottom 10% for per-person income were 2.8 times more likely than average to appear in the bottom 10% of areas for full-fibre take-up. In other words, people in lower-income areas are much less likely to be using full fibre broadband.
- Urban areas are more likely to have low take-up, regardless of income levels, due to the availability of alternatives to full-fibre broadband such as Virgin Media cable technology.
- Regardless of income, areas of the country with increased levels of broadband competition, such as through altnet providers, have higher rates of full-fibre adoption. This is most clearly seen in Northern Ireland, where the widespread availability of cheap full fibre broadband supplied by Fibrus has led to very high take-up rates.
Full fibre take-up map
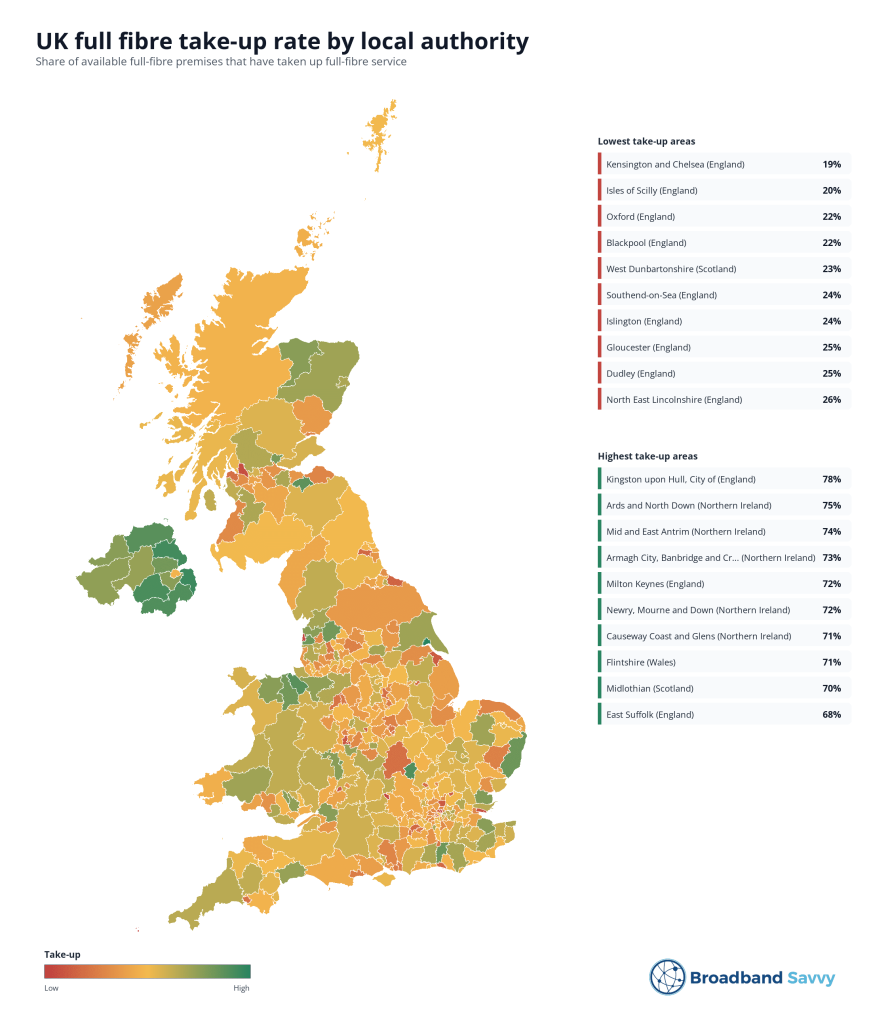
Data as of January 2026.
Why are certain areas missing out on full fibre?
We found there are two main reasons why people are failing to upgrade to full fibre broadband:
- In urban areas such as Oxford and central London, there is widespread availability of gigabit broadband delivered through technology types other than full fibre, such as hybrid fibre coaxial cable. In these regions, full fibre take-up has been limited due to the existing availability of fast broadband solutions.
- In lower-income areas such as Blackpool, West Dunbartonshire, and Dudley, where there are fewer altnets to choose from and less price competition, full fibre uptake rates are often around half of the national average due to affordability constraints.
“The digital divide is the biggest it has ever been in the UK,” said Tom Paton, founder of Broadband Savvy.
“With household living expenses constantly rising – including broadband contracts with their mid-contract price rises – we’re seeing more and more people struggle to afford fast broadband, including those that spend a lot of time online.”
“Certain parts of the country simply cannot afford to access full fibre broadband, and are stuck with antiquated copper technology or no broadband connection at all as a result.”
“The one saving grace for British consumers over the past decade has been broadband altnets, and the extremely discounted prices they’re currently offering. In certain areas, such as Northern Ireland and Hull, these companies have allowed people to access full fibre broadband for a much more reasonable price compared to what incumbent providers are charging.”
“However, once these altnet providers gain market share, it is likely they will begin raising prices to be more in line with the competition, again forcing hundreds of thousands of people to forgo fast broadband or cancel their connections altogether.”
While social tariffs offer a means for those on lower incomes to access fast broadband for a reasonable price, there remains a significant lack of awareness that these discounted plans exist.
“Last year it was estimated that billions of pounds of social tariff discounts were being missed out on due to a lack of awareness, and we believe that number is higher today. Approximately fifty percent of those eligible are unaware that they can get a discounted broadband plan using a social tariff.”
“Those on lower incomes need greater support to access the connectivity they need to work, learn, and keep in touch with friends and loved ones in the modern age. The first step must be to raise awareness of social tariffs – we think that providers should be required to advertise these packages prominently on their website, rather than leaving them buried deep on a page that can’t be found without searching specifically for it.”
Full data
| Local authority | Full-fibre take-up | Household income per person | National household income rank |
|---|---|---|---|
| Kensington and Chelsea | 19% | £96,578 | Top 1% |
| Isles of Scilly | 20% | £24,821 | Top 27% |
| Blackpool | 22% | £17,413 | Bottom 7% |
| Oxford | 22% | £22,868 | Top 37% |
| West Dunbartonshire | 23% | £17,602 | Bottom 9% |
| Islington | 24% | £38,628 | Top 2% |
| Southend-on-Sea | 24% | £22,919 | Top 37% |
| Dudley | 25% | £17,644 | Bottom 10% |
| Gloucester | 25% | £18,485 | Bottom 22% |
| Camden | 26% | £58,440 | Top 1% |
| Enfield | 26% | £25,516 | Top 22% |
| Harlow | 26% | £19,127 | Bottom 28% |
| North East Lincolnshire | 26% | £18,139 | Bottom 16% |
| Tamworth | 27% | £18,159 | Bottom 17% |
| Redcar and Cleveland | 28% | £17,686 | Bottom 11% |
| Brighton and Hove | 29% | £26,461 | Top 19% |
| Gateshead | 29% | £17,600 | Bottom 9% |
| Surrey Heath | 29% | £30,451 | Top 9% |
| Ashfield | 31% | £17,016 | Bottom 6% |
| Inverclyde | 31% | £18,982 | Bottom 27% |
| Lincoln | 31% | £16,215 | Bottom 3% |
| Luton | 31% | £17,944 | Bottom 13% |
| West Northamptonshire | 31% | £22,575 | Top 41% |
| Leicester | 32% | £15,075 | Bottom 1% |
| Newcastle-under-Lyme | 32% | £19,836 | Bottom 34% |
| Plymouth | 32% | £18,677 | Bottom 23% |
| Blackburn with Darwen | 33% | £15,884 | Bottom 2% |
| Crawley | 33% | £19,881 | Bottom 35% |
| Oadby and Wigston | 33% | £19,996 | Bottom 36% |
| Rushmoor | 33% | £20,955 | Bottom 45% |
| Stoke-on-Trent | 33% | £15,900 | Bottom 2% |
| Woking | 33% | £29,827 | Top 10% |
| Bournemouth, Christchurch and Poole | 34% | £23,108 | Top 35% |
| Cambridge | 34% | £23,855 | Top 32% |
| Havant | 34% | £22,106 | Top 45% |
| Nottingham | 34% | £15,434 | Bottom 1% |
| Portsmouth | 34% | £19,388 | Bottom 30% |
| Calderdale | 35% | £19,489 | Bottom 32% |
| Charnwood | 35% | £20,143 | Bottom 37% |
| Mid Suffolk | 35% | £22,826 | Top 38% |
| Wolverhampton | 35% | £16,987 | Bottom 5% |
| Bolton | 36% | £17,977 | Bottom 14% |
| Castle Point | 36% | £23,389 | Top 34% |
| Dundee City | 36% | £17,653 | Bottom 10% |
| East Lothian | 36% | £23,988 | Top 32% |
| Haringey | 36% | £33,461 | Top 5% |
| North Norfolk | 36% | £21,953 | Top 47% |
| Winchester | 36% | £29,584 | Top 11% |
| Barnsley | 37% | £18,427 | Bottom 20% |
| Birmingham | 37% | £16,950 | Bottom 5% |
| Brent | 37% | £27,434 | Top 16% |
| Croydon | 37% | £25,169 | Top 24% |
| Ealing | 37% | £27,679 | Top 16% |
| Hackney | 37% | £31,388 | Top 7% |
| Preston | 37% | £17,243 | Bottom 6% |
| South Ayrshire | 37% | £20,983 | Bottom 46% |
| Stevenage | 37% | £20,606 | Bottom 43% |
| Warwick | 37% | £25,770 | Top 21% |
| Broxbourne | 38% | £24,071 | Top 31% |
| Hartlepool | 38% | £17,992 | Bottom 15% |
| Mansfield | 38% | £17,950 | Bottom 14% |
| North Lincolnshire | 38% | £18,195 | Bottom 18% |
| Renfrewshire | 38% | £18,905 | Bottom 25% |
| Richmond upon Thames | 38% | £45,752 | Top 1% |
| South Holland | 38% | £19,391 | Bottom 30% |
| St. Helens | 38% | £18,157 | Bottom 17% |
| York | 38% | £21,981 | Top 46% |
| Bradford | 39% | £16,274 | Bottom 3% |
| Cheltenham | 39% | £24,110 | Top 30% |
| Colchester | 39% | £21,583 | Top 48% |
| Falkirk | 39% | £19,559 | Bottom 32% |
| Hertsmere | 39% | £33,768 | Top 4% |
| Hounslow | 39% | £26,491 | Top 18% |
| Mole Valley | 39% | £35,330 | Top 3% |
| Neath Port Talbot | 39% | £17,612 | Bottom 9% |
| Bath and North East Somerset | 40% | £24,779 | Top 27% |
| Blaby | 40% | £19,762 | Bottom 34% |
| City of Edinburgh | 40% | £26,565 | Top 18% |
| Hammersmith and Fulham | 40% | £44,541 | Top 2% |
| Melton | 40% | £22,755 | Top 40% |
| North Lanarkshire | 40% | £18,143 | Bottom 16% |
| Sandwell | 40% | £15,305 | Bottom 1% |
| Sefton | 40% | £20,208 | Bottom 38% |
| Sunderland | 40% | £17,458 | Bottom 7% |
| Telford and Wrekin | 40% | £18,679 | Bottom 23% |
| Wigan | 40% | £17,798 | Bottom 11% |
| Angus | 41% | £20,352 | Bottom 40% |
| Boston | 41% | £18,332 | Bottom 19% |
| Burnley | 41% | £15,732 | Bottom 1% |
| East Hampshire | 41% | £28,944 | Top 13% |
| East Renfrewshire | 41% | £24,829 | Top 27% |
| East Staffordshire | 41% | £19,203 | Bottom 29% |
| Fareham | 41% | £24,075 | Top 31% |
| Gosport | 41% | £20,007 | Bottom 37% |
| Hart | 41% | £30,226 | Top 9% |
| Hinckley and Bosworth | 41% | £20,823 | Bottom 45% |
| Ipswich | 41% | £18,240 | Bottom 18% |
| Kingston upon Thames | 41% | £31,129 | Top 8% |
| North Yorkshire | 41% | £24,277 | Top 29% |
| Rochdale | 41% | £16,872 | Bottom 4% |
| Staffordshire Moorlands | 41% | £20,962 | Bottom 45% |
| Stockport | 41% | £23,192 | Top 35% |
| Barnet | 42% | £33,730 | Top 4% |
| Bromley | 42% | £30,888 | Top 9% |
| Derby | 42% | £17,294 | Bottom 6% |
| East Lindsey | 42% | £19,807 | Bottom 34% |
| Havering | 42% | £24,913 | Top 26% |
| Lambeth | 42% | £32,669 | Top 6% |
| New Forest | 42% | £26,570 | Top 18% |
| Reading | 42% | £22,779 | Top 39% |
| Bristol, City of | 43% | £22,465 | Top 41% |
| Broxtowe | 43% | £19,700 | Bottom 33% |
| Darlington | 43% | £19,056 | Bottom 27% |
| Erewash | 43% | £19,431 | Bottom 31% |
| Gedling | 43% | £20,690 | Bottom 43% |
| Glasgow City | 43% | £18,571 | Bottom 22% |
| High Peak | 43% | £21,573 | Top 49% |
| Lewisham | 43% | £27,282 | Top 16% |
| Medway | 43% | £21,277 | Bottom 49% |
| Na h-Eileanan Siar | 43% | £20,233 | Bottom 39% |
| Newark and Sherwood | 43% | £22,051 | Top 45% |
| North West Leicestershire | 43% | £20,754 | Bottom 44% |
| Solihull | 43% | £24,228 | Top 29% |
| Stroud | 43% | £25,260 | Top 24% |
| Swansea | 43% | £17,978 | Bottom 14% |
| Trafford | 43% | £25,802 | Top 21% |
| Windsor and Maidenhead | 43% | £34,929 | Top 4% |
| Cumberland | 44% | £19,333 | Bottom 30% |
| Great Yarmouth | 44% | £18,815 | Bottom 25% |
| Guildford | 44% | £32,201 | Top 7% |
| Halton | 44% | £19,124 | Bottom 28% |
| North Devon | 44% | £21,259 | Bottom 49% |
| Rotherham | 44% | £17,739 | Bottom 11% |
| South Lanarkshire | 44% | £20,445 | Bottom 41% |
| South Staffordshire | 44% | £23,710 | Top 32% |
| South Tyneside | 44% | £17,654 | Bottom 10% |
| Watford | 44% | £23,518 | Top 34% |
| Arun | 45% | £23,068 | Top 36% |
| Buckinghamshire | 45% | £30,659 | Top 9% |
| Cardiff | 45% | £19,106 | Bottom 27% |
| Derbyshire Dales | 45% | £26,870 | Top 17% |
| Dorset | 45% | £24,156 | Top 30% |
| Fenland | 45% | £19,121 | Bottom 27% |
| Forest of Dean | 45% | £20,545 | Bottom 42% |
| Harrow | 45% | £28,501 | Top 14% |
| Hillingdon | 45% | £23,695 | Top 33% |
| Liverpool | 45% | £17,408 | Bottom 7% |
| Manchester | 45% | £17,615 | Bottom 9% |
| Nuneaton and Bedworth | 45% | £18,577 | Bottom 22% |
| Redditch | 45% | £20,555 | Bottom 42% |
| South Oxfordshire | 45% | £31,132 | Top 8% |
| Stockton-on-Tees | 45% | £18,608 | Bottom 23% |
| Walsall | 45% | £16,853 | Bottom 4% |
| Warrington | 45% | £22,152 | Top 44% |
| Wyre Forest | 45% | £21,072 | Bottom 47% |
| Adur | 46% | £21,774 | Top 48% |
| Babergh | 46% | £24,841 | Top 26% |
| Gravesham | 46% | £22,535 | Top 41% |
| Newport | 46% | £17,558 | Bottom 8% |
| Orkney Islands | 46% | £21,132 | Bottom 47% |
| Pembrokeshire | 46% | £19,125 | Bottom 28% |
| South Derbyshire | 46% | £21,190 | Bottom 48% |
| Welwyn Hatfield | 46% | £25,371 | Top 23% |
| Wokingham | 46% | £28,641 | Top 13% |
| Bedford | 47% | £22,414 | Top 42% |
| Belfast | 47% | £18,276 | Bottom 19% |
| Dacorum | 47% | £27,834 | Top 15% |
| Hastings | 47% | £20,007 | Bottom 37% |
| Highland | 47% | £21,303 | Bottom 50% |
| Hyndburn | 47% | £15,780 | Bottom 2% |
| Kirklees | 47% | £18,272 | Bottom 19% |
| Lewes | 47% | £25,890 | Top 20% |
| Newcastle upon Tyne | 47% | £18,136 | Bottom 16% |
| Rhondda Cynon Taf | 47% | £17,281 | Bottom 6% |
| Slough | 47% | £19,590 | Bottom 32% |
| South Hams | 47% | £26,872 | Top 17% |
| Waltham Forest | 47% | £25,878 | Top 21% |
| Worthing | 47% | £23,051 | Top 36% |
| Bolsover | 48% | £17,866 | Bottom 12% |
| Broadland | 48% | £22,208 | Top 44% |
| Dartford | 48% | £22,763 | Top 39% |
| Folkestone and Hythe | 48% | £22,951 | Top 37% |
| King's Lynn and West Norfolk | 48% | £20,369 | Bottom 40% |
| North Hertfordshire | 48% | £26,787 | Top 17% |
| North Tyneside | 48% | £19,171 | Bottom 29% |
| Pendle | 48% | £16,896 | Bottom 5% |
| Rossendale | 48% | £19,396 | Bottom 31% |
| Rother | 48% | £24,725 | Top 28% |
| Runnymede | 48% | £28,789 | Top 13% |
| Rutland | 48% | £28,090 | Top 15% |
| Southampton | 48% | £18,758 | Bottom 24% |
| St Albans | 48% | £35,264 | Top 3% |
| Stafford | 48% | £22,155 | Top 44% |
| Sutton | 48% | £25,097 | Top 24% |
| Waverley | 48% | £36,306 | Top 3% |
| Basildon | 49% | £22,236 | Top 43% |
| Bassetlaw | 49% | £19,662 | Bottom 32% |
| Dumfries and Galloway | 49% | £20,326 | Bottom 39% |
| Epping Forest | 49% | £33,619 | Top 5% |
| Exeter | 49% | £18,724 | Bottom 24% |
| Mid Devon | 49% | £22,116 | Top 45% |
| Northumberland | 49% | £21,359 | Middle |
| Reigate and Banstead | 49% | £29,893 | Top 10% |
| Rushcliffe | 49% | £25,560 | Top 22% |
| Shetland Islands | 49% | £22,025 | Top 46% |
| Torfaen | 49% | £17,410 | Bottom 7% |
| Westminster | 49% | £69,058 | Top 1% |
| Argyll and Bute | 50% | £20,701 | Bottom 43% |
| Bracknell Forest | 50% | £24,923 | Top 26% |
| Braintree | 50% | £23,345 | Top 34% |
| Chesterfield | 50% | £18,333 | Bottom 20% |
| County Durham | 50% | £17,904 | Bottom 12% |
| East Hertfordshire | 50% | £29,761 | Top 10% |
| Elmbridge | 50% | £44,307 | Top 2% |
| Huntingdonshire | 50% | £22,317 | Top 43% |
| Isle of Wight | 50% | £20,749 | Bottom 44% |
| Knowsley | 50% | £17,832 | Bottom 12% |
| Leeds | 50% | £19,965 | Bottom 35% |
| Merton | 50% | £33,360 | Top 5% |
| North Northamptonshire | 50% | £20,629 | Bottom 43% |
| North Warwickshire | 50% | £20,460 | Bottom 42% |
| South Norfolk | 50% | £22,787 | Top 39% |
| Tameside | 50% | £17,472 | Bottom 8% |
| Tandridge | 50% | £31,686 | Top 7% |
| Thurrock | 50% | £21,329 | Bottom 50% |
| Torridge | 50% | £20,407 | Bottom 41% |
| Wandsworth | 50% | £43,701 | Top 2% |
| Eastbourne | 51% | £21,980 | Top 47% |
| Harborough | 51% | £26,213 | Top 19% |
| Norwich | 51% | £17,993 | Bottom 15% |
| Oldham | 51% | £16,499 | Bottom 3% |
| Peterborough | 51% | £18,604 | Bottom 22% |
| Salford | 51% | £19,395 | Bottom 31% |
| Sheffield | 51% | £17,955 | Bottom 14% |
| Somerset | 51% | £22,231 | Top 43% |
| Spelthorne | 51% | £26,351 | Top 19% |
| Teignbridge | 51% | £22,824 | Top 38% |
| Torbay | 51% | £19,990 | Bottom 36% |
| Central Bedfordshire | 52% | £23,579 | Top 34% |
| Gwynedd | 52% | £17,905 | Bottom 13% |
| Maidstone | 52% | £23,766 | Top 32% |
| Perth and Kinross | 52% | £22,833 | Top 38% |
| Redbridge | 52% | £25,089 | Top 25% |
| Rugby | 52% | £21,409 | Top 50% |
| Scottish Borders | 52% | £21,187 | Bottom 47% |
| South Cambridgeshire | 52% | £29,050 | Top 12% |
| Test Valley | 52% | £26,074 | Top 20% |
| Uttlesford | 52% | £29,456 | Top 11% |
| West Berkshire | 52% | £28,281 | Top 14% |
| West Oxfordshire | 52% | £28,583 | Top 14% |
| West Suffolk | 52% | £21,196 | Bottom 48% |
| Wychavon | 52% | £24,466 | Top 28% |
| Chelmsford | 53% | £25,662 | Top 22% |
| Chichester | 53% | £29,357 | Top 12% |
| Cotswold | 53% | £33,334 | Top 6% |
| East Dunbartonshire | 53% | £25,270 | Top 23% |
| Fife | 53% | £19,314 | Bottom 30% |
| Isle of Anglesey | 53% | £19,184 | Bottom 29% |
| North Kesteven | 53% | £20,318 | Bottom 39% |
| North Somerset | 53% | £24,330 | Top 29% |
| Shropshire | 53% | £21,441 | Top 50% |
| South Kesteven | 53% | £22,864 | Top 37% |
| Tendring | 53% | £21,099 | Bottom 47% |
| Tewkesbury | 53% | £22,620 | Top 40% |
| Amber Valley | 54% | £20,715 | Bottom 44% |
| Bexley | 54% | £24,374 | Top 28% |
| Blaenau Gwent | 54% | £15,568 | Bottom 1% |
| City of London | 54% | £138,081 | Top 1% |
| Doncaster | 54% | £18,280 | Bottom 19% |
| Dover | 54% | £21,980 | Top 47% |
| Eastleigh | 54% | £22,117 | Top 45% |
| Monmouthshire | 54% | £24,081 | Top 31% |
| North East Derbyshire | 54% | £20,421 | Bottom 41% |
| Sevenoaks | 54% | £33,984 | Top 4% |
| Southwark | 54% | £31,897 | Top 7% |
| Swindon | 54% | £20,370 | Bottom 40% |
| Three Rivers | 54% | £32,449 | Top 6% |
| Tonbridge and Malling | 54% | £26,584 | Top 17% |
| Vale of White Horse | 54% | £26,435 | Top 19% |
| Wiltshire | 54% | £24,212 | Top 30% |
| Wrexham | 54% | £18,457 | Bottom 21% |
| Basingstoke and Deane | 55% | £25,531 | Top 22% |
| Canterbury | 55% | £21,999 | Top 46% |
| Chorley | 55% | £21,244 | Bottom 49% |
| Greenwich | 55% | £26,020 | Top 20% |
| Lichfield | 55% | £24,765 | Top 27% |
| Ceredigion | 56% | £17,838 | Bottom 12% |
| Cherwell | 56% | £24,927 | Top 25% |
| East Cambridgeshire | 56% | £25,083 | Top 25% |
| Herefordshire, County of | 56% | £22,726 | Top 40% |
| Newham | 56% | £22,357 | Top 42% |
| North Ayrshire | 56% | £18,353 | Bottom 20% |
| Powys | 56% | £19,772 | Bottom 34% |
| Tunbridge Wells | 56% | £30,906 | Top 8% |
| Vale of Glamorgan | 56% | £22,364 | Top 42% |
| West Devon | 56% | £21,775 | Top 47% |
| West Lindsey | 56% | £21,580 | Top 48% |
| Westmorland and Furness | 56% | £23,103 | Top 36% |
| Cornwall | 57% | £21,235 | Bottom 48% |
| Middlesbrough | 57% | £16,670 | Bottom 4% |
| Rochford | 57% | £24,217 | Top 30% |
| South Ribble | 57% | £20,187 | Bottom 38% |
| Stratford-on-Avon | 57% | £29,741 | Top 11% |
| Wirral | 57% | £20,043 | Bottom 37% |
| Brentwood | 58% | £32,465 | Top 6% |
| Bury | 58% | £20,278 | Bottom 39% |
| Cannock Chase | 58% | £18,225 | Bottom 18% |
| Cheshire East | 58% | £25,982 | Top 20% |
| Stirling | 58% | £22,756 | Top 40% |
| Tower Hamlets | 58% | £29,182 | Top 12% |
| West Lancashire | 58% | £21,486 | Top 49% |
| Aberdeen City | 59% | £21,004 | Bottom 46% |
| Barking and Dagenham | 59% | £19,246 | Bottom 29% |
| Bridgend | 59% | £18,193 | Bottom 17% |
| East Ayrshire | 59% | £18,961 | Bottom 26% |
| Epsom and Ewell | 59% | £29,476 | Top 11% |
| Horsham | 59% | £29,440 | Top 12% |
| Thanet | 59% | £21,235 | Bottom 48% |
| West Lothian | 59% | £20,355 | Bottom 40% |
| Ashford | 60% | £23,708 | Top 33% |
| Coventry | 60% | £17,772 | Bottom 11% |
| Lancaster | 60% | £18,434 | Bottom 21% |
| Wakefield | 60% | £18,860 | Bottom 25% |
| Wealden | 60% | £27,916 | Top 15% |
| Aberdeenshire | 61% | £23,174 | Top 35% |
| Breckland | 61% | £19,999 | Bottom 36% |
| Carmarthenshire | 61% | £18,179 | Bottom 17% |
| East Riding of Yorkshire | 61% | £21,547 | Top 49% |
| Bromsgrove | 62% | £25,342 | Top 23% |
| East Devon | 62% | £23,635 | Top 33% |
| Mid Ulster | 62% | £18,468 | Bottom 21% |
| Caerphilly | 63% | £17,914 | Bottom 13% |
| Cheshire West and Chester | 63% | £22,376 | Top 42% |
| Fermanagh and Omagh | 63% | £18,127 | Bottom 16% |
| Conwy | 64% | £19,749 | Bottom 33% |
| Derry City and Strabane | 64% | £17,520 | Bottom 8% |
| Lisburn and Castlereagh | 64% | £20,450 | Bottom 42% |
| Malvern Hills | 64% | £24,945 | Top 25% |
| Merthyr Tydfil | 64% | £16,621 | Bottom 4% |
| Moray | 64% | £19,844 | Bottom 35% |
| South Gloucestershire | 64% | £23,233 | Top 35% |
| Swale | 64% | £21,612 | Top 48% |
| Wyre | 64% | £20,813 | Bottom 45% |
| Maldon | 65% | £25,116 | Top 24% |
| Clackmannanshire | 66% | £19,846 | Bottom 35% |
| Worcester | 66% | £18,889 | Bottom 25% |
| Antrim and Newtownabbey | 67% | £18,925 | Bottom 26% |
| Denbighshire | 67% | £18,717 | Bottom 24% |
| Ribble Valley | 67% | £27,425 | Top 16% |
| East Suffolk | 68% | £22,763 | Top 39% |
| Fylde | 68% | £24,259 | Top 29% |
| Mid Sussex | 68% | £28,210 | Top 14% |
| Midlothian | 70% | £20,997 | Bottom 46% |
| Causeway Coast and Glens | 71% | £18,911 | Bottom 26% |
| Flintshire | 71% | £19,723 | Bottom 33% |
| Milton Keynes | 72% | £22,330 | Top 43% |
| Newry, Mourne and Down | 72% | £18,073 | Bottom 15% |
| Armagh City, Banbridge and Craigavon | 73% | £18,389 | Bottom 20% |
| Mid and East Antrim | 74% | £18,813 | Bottom 24% |
| Ards and North Down | 75% | £20,166 | Bottom 38% |
| Kingston upon Hull, City of | 78% | £15,818 | Bottom 2% |
Methodology
We used Ofcom Connected Nations data from January 2026 to map full fibre adoption rates across each Local Authority District (LAD) in the UK.
For each LAD, we compared the number of premises that had taken up full fibre with the number of premises where full fibre was available, to calculate a take-up rate in each region.
We assessed average income levels in each LAD using the Office for National Statistics’ Gross Disposable Household Income (GDHI) metric. GDHI estimates the amount of money households have available to spend or save after taxes, benefits, and other income adjustments, giving a measurement of the average annual income of each household in a given area. We used the per-person version of this metric released by ONS to assess individual income levels in each region.
Each LAD was ranked based on its full fibre take-up percentage from low to high. The distribution was then compared against GDHI values to assess the correlation between full fibre take-up and household income levels in each district.
Related resources
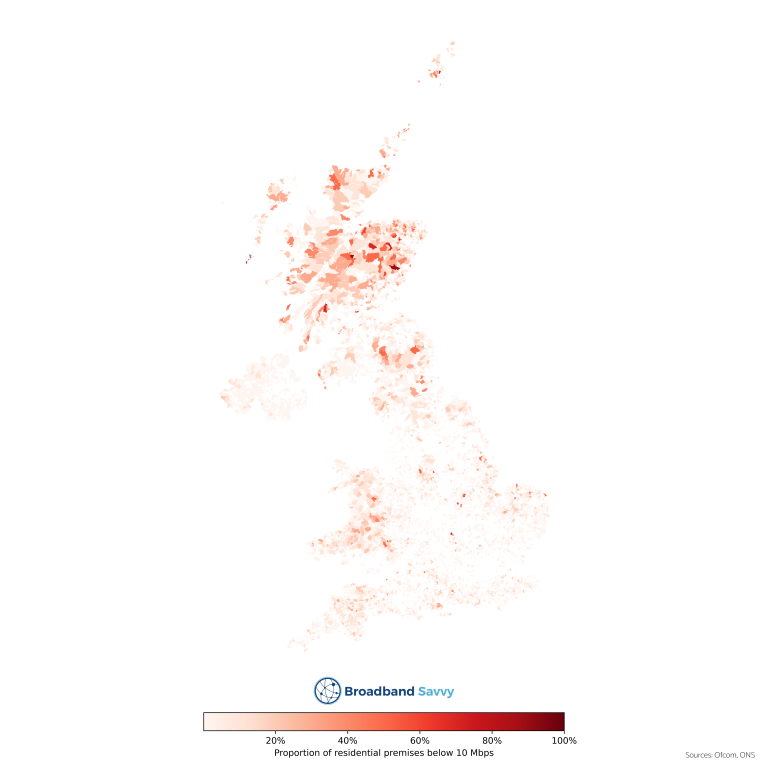
Report: UK’s Worst Broadband – Mapping Digital Exclusion
We map digital exclusion in the UK by assessing the proportion of households in each census area with download speeds lower than 10 Mbps.
Study: Ranking UK Broadband Providers’ Sustainability Commitments
We analyse the environmental sustainability of the UK's largest ISPs. Discover which broadband providers are reducing their carbon footprint.

Study: Britain’s Broadband Divide – £15/month in Cardiff, 76% More Elsewhere
Does your city have cheap or expensive broadband? Discover what broadband costs per month in each city of the UK.
Study: Haggling For Broadband Can Save You £251 On Average
We found that haggling for a better deal when renewing your broadband plan can help you save £251 on average over the life of...

Tyler is the co-founder of Broadband Savvy. He has been helping people improve their broadband connectivity since 2018 by writing about fibre broadband and mobile broadband providers, as well as creating tutorials to help people improve their broadband speeds and Wi-Fi signal.
Tyler is responsible for the majority of buyer’s guides and broadband reviews published on Broadband Savvy. He has a wealth of experience testing and reviewing different broadband tariffs, including fibre internet plans, as well as 4G and 5G broadband deals. He is responsible for testing and evaluating Wi-Fi routers, performing speed and latency tests, and comparing the value for money of different broadband providers on the market in the UK.
Before co-founding Broadband Savvy, Tyler had a long history of tinkering with computers. He built his first PC at the age of 12, and since then, he’s become obsessed with all things networking and internet-related. He’s a massive gamer, loves Rocket League, and also plays Sunday League football.